
8 Best TAM Mapping Tools for GTM Engineers
The 8 tools GTM engineers actually use to build a real, queryable total addressable market: overview, features, pros and cons, and 2026 pricing for each.
On this page
- What TAM mapping actually means for a GTM engineer?
- 8 Best TAM mapping tools for GTM engineers
- 1. Clay
- 2. Apollo.io
- 3. ZoomInfo
- 4. Crunchbase
- 5. 6sense
- 6. LinkedIn sales navigator
- 7. BuiltWith
- 8. PitchBook
- How these tools actually combine?
- Common Mistakes in TAM Mapping
- A worked example
- How I approach TAM mapping?
- Conclusion
Most TAM mapping content is written for a strategy deck: a market-sizing slide with a top-down number, a middle circle, and an inner circle, presented once at a board meeting and never touched again.
That's not what TAM mapping means for a GTM engineer. For this role, TAM mapping is an engineering task: building an actual, queryable universe of accounts that match your ICP, enriched well enough that scoring, routing, and outbound systems can operate against it directly, and kept current rather than frozen as a one-time slide.
This guide covers the 8 tools GTM engineers actually use to build that universe, each with a real overview, the specific features that matter for TAM work, honest pros and cons, and current 2026 pricing.
What TAM mapping actually means for a GTM engineer?
A strategist's TAM exercise answers "how big is this market." A GTM engineer's TAM mapping answers a more operational question: "which specific companies, identifiable and enrichable right now, actually belong in our addressable universe, and how do I keep that list current as the market changes."
The output isn't a number on a slide, it's a living, structured dataset that feeds scoring models, routing logic, and outbound systems directly.
This distinction shapes which tools actually matter here. A tool that's excellent for a one-time strategic market-sizing exercise isn't automatically the right tool for maintaining an operational, continuously enriched account universe, and several of the tools below serve one job considerably better than the other.
8 Best TAM mapping tools for GTM engineers
1. Clay

Overview: Clay is a programmable enrichment and orchestration platform, and for GTM engineers specifically, it's often the strongest tool for building a genuinely custom TAM definition rather than accepting a rigid, pre-built filter set.
Since it orchestrates dozens of underlying data providers in a waterfall, it can construct an account universe based on criteria no single database's native filter structure supports.
Features:
- Programmable, conditional filtering logic across firmographic, technographic, and signal-based criteria simultaneously
- Waterfall enrichment across 100+ underlying data providers
- Claygent for open-ended research questions a structured filter can't answer, confirming a nuanced fit criterion from a company's public content
- Native exports and CRM sync for operationalizing the resulting TAM list directly
| Pros | Cons |
|---|---|
| Genuinely custom TAM logic no fixed filter builder can replicate | Requires real setup time and workflow-building skill |
| Combines firmographic, technographic, and signal data in one system | Cost scales with usage, requiring active management to stay efficient |
| Continuously re-runnable, keeping the TAM list current rather than static | No native large-scale market visualization or reporting layer |
| Plan | Price | Notes |
|---|---|---|
| Free | $0/month | Limited credits, enough for testing a workflow |
| Starter | Roughly $149/month | Entry paid tier for smaller-scale TAM builds |
| Higher tiers | Scales with credit usage | Usage-based; cost depends on data source mix and volume |
2. Apollo.io
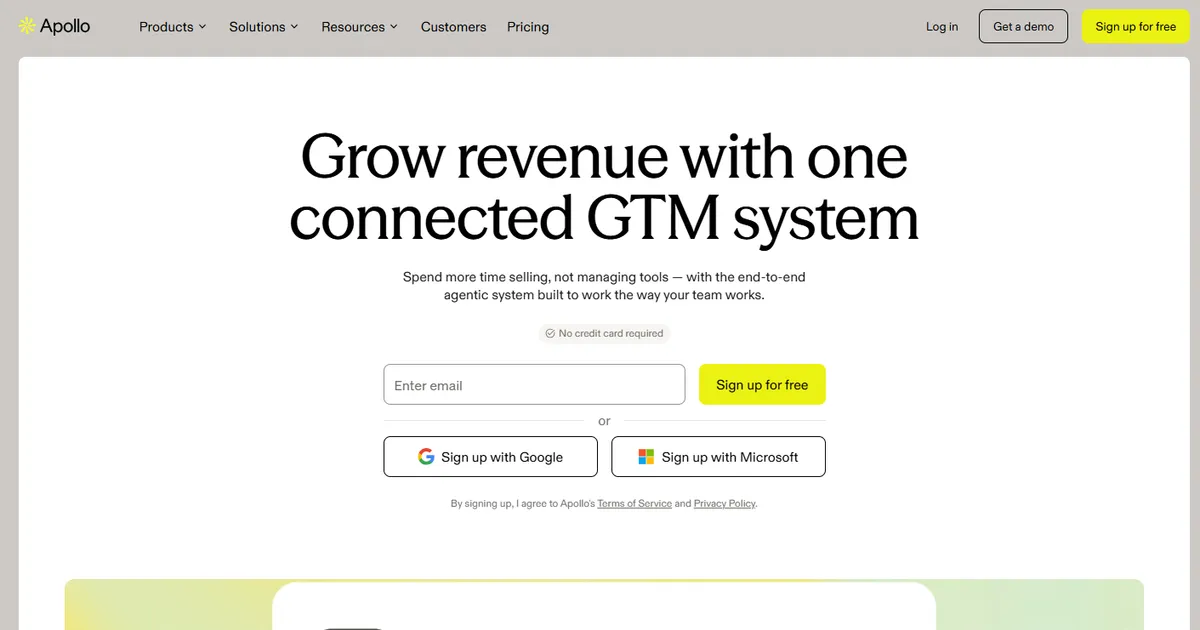
Overview: Apollo combines a large, self-serve contact and company database with built-in filtering, making it the most accessible entry point for a GTM engineer who needs a working TAM list fast, without the setup investment a fully programmable tool like Clay requires.
Features:
- A large firmographic and contact database with credit-based access
- Native filter builder for company size, industry, technology, and location
- Saved segments that can be re-pulled on a schedule to keep a TAM list current
- Built-in sequencing, letting a TAM list move directly into outreach without a separate export
| Pros | Cons |
|---|---|
| Fastest path to a working TAM list, minimal setup required | Filter logic is less flexible than a programmable tool for genuinely custom criteria |
| Bundles data and execution in one subscription | Coverage and accuracy vary by segment, weaker in some verticals than a specialized provider |
| Affordable entry point relative to enterprise alternatives | Credit consumption can add up fast at real TAM-list scale |
| Plan | Price | Notes |
|---|---|---|
| Free | $0/month | Limited credits and features |
| Basic | Roughly $49/user/month (annual) | Core filtering and list-building |
| Professional | Roughly $79/user/month (annual) | Adds AI features and dialer |
| Organization | Roughly $119/user/month (annual) | Three-seat minimum; advanced reporting |
3. ZoomInfo
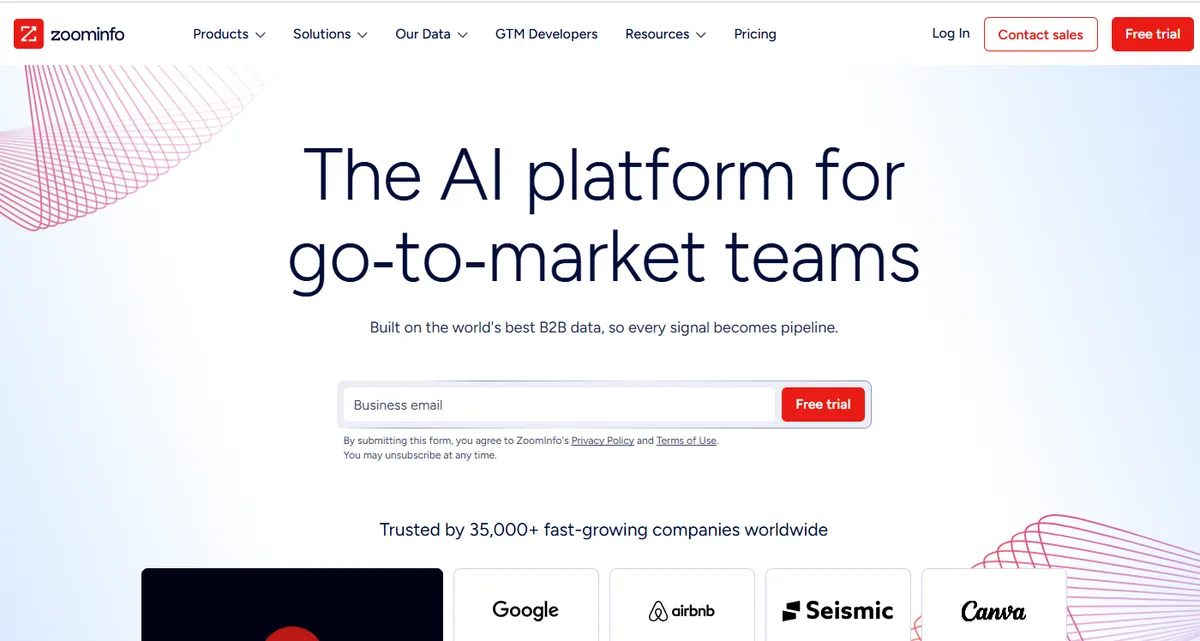
Overview: ZoomInfo remains the largest, most enterprise-oriented firmographic and contact database available, and for GTM engineers building a TAM list for a company targeting larger, more established accounts specifically, its coverage depth in that segment is hard to match with a smaller or newer provider.
Features:
- Very broad company and contact coverage, particularly strong in mid-market and enterprise segments
- Advanced firmographic and org-chart filtering for precise TAM segmentation
- Native intent and technographic data layered into the same platform
- Deep CRM and marketing automation integrations for operationalizing a TAM list at scale
| Pros | Cons |
|---|---|
| Deepest enterprise and mid-market coverage of any tool on this list | Among the most expensive options, particularly for a smaller team |
| Combines firmographic, technographic, and intent data natively | Contracts tend to be longer and less flexible than self-serve alternatives |
| Strong native integrations for operational use, not just list export | Can be more data than a lean team actually needs for a focused TAM |
| Plan | Price | Notes |
|---|---|---|
| SalesOS | Custom quote | Typically starts in the low thousands per user annually |
| Marketing/Talent add-ons | Custom quote | Priced separately by module |
| Enterprise | Custom quote | Scales into significant annual contracts for larger TAM and seat counts |
Want a read on which of these tools actually fits your specific TAM criteria? Get a free AI infrastructure audit and I'll help you map it.
4. Crunchbase
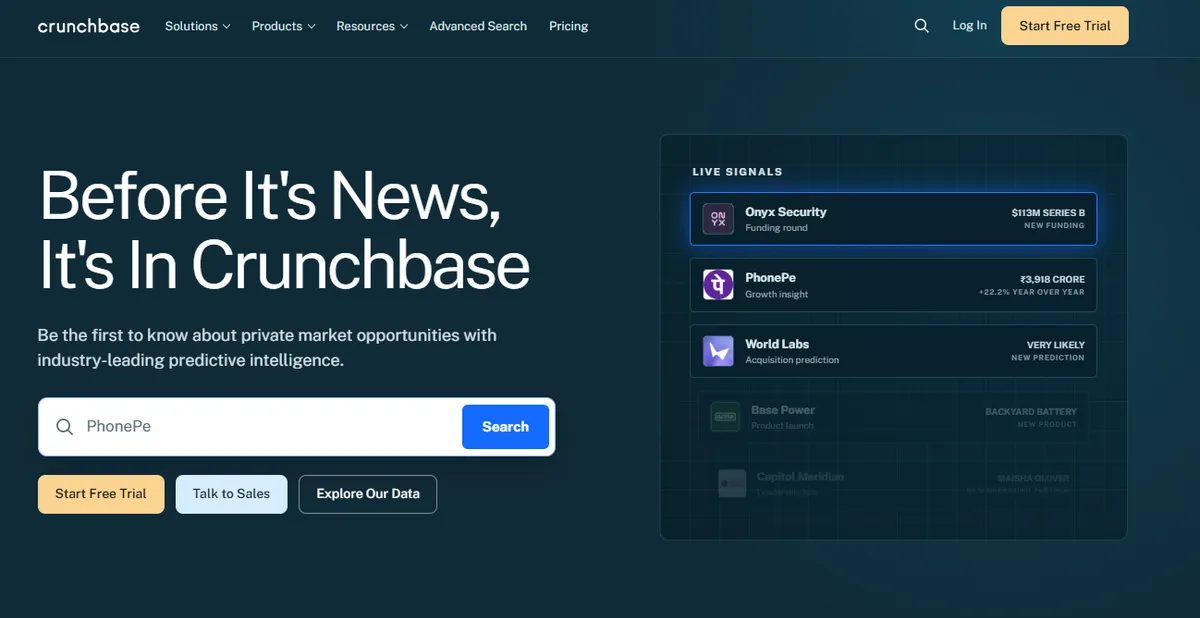
Overview: Crunchbase's core strength is depth on funded, venture-backed, and growth-stage companies, making it a particularly strong fit for a GTM engineer whose TAM specifically includes startups and scaling companies rather than only large, established enterprises. Its "Similar Companies" feature is a genuinely useful, underused tool for TAM expansion specifically.
Features:
- Deep funding, investor, and growth-stage data across millions of company profiles
- AI-powered predictive signals on the Business tier, flagging companies likely to raise a next round
- A "Similar Companies" feature for finding lookalike accounts to expand a TAM definition beyond a direct search
- API access for pulling TAM data directly into a broader enrichment or scoring pipeline
| Pros | Cons |
|---|---|
| Best-in-category depth on startup and growth-stage company data | Export caps on the Pro tier, roughly 2,000 rows a month, constrain large-scale TAM pulls |
| "Similar Companies" is a genuinely strong TAM expansion feature | Contact data is thin; needs pairing with a dedicated enrichment tool |
| More affordable than ZoomInfo or PitchBook for its specific niche | Predictive signals and CRM integrations require the pricier Business tier |
| Plan | Price | Notes |
|---|---|---|
| Pro | Roughly $49-$99/user/month (annual) | Advanced search, saved searches, alerts |
| Business | Roughly $199/user/month | Adds CRM integrations and predictive AI signals |
| Enterprise | Custom quote | API access, bulk exports, custom integrations |
5. 6sense
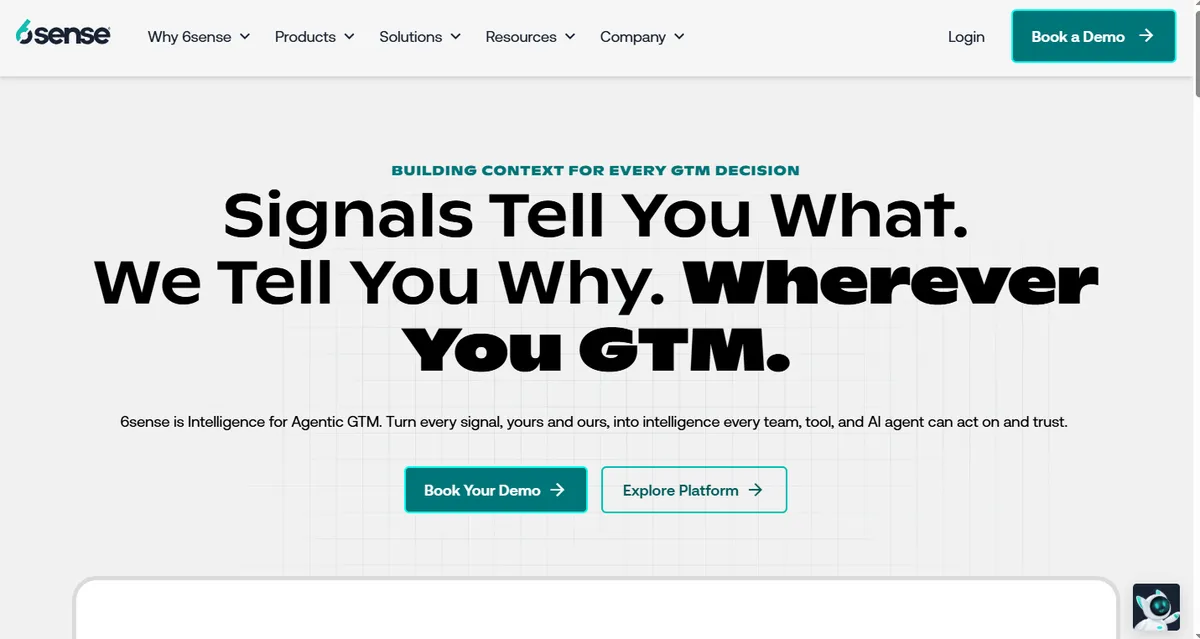
Overview: 6sense is a predictive ABM and intent platform, and for a GTM engineer whose TAM mapping needs to go beyond static firmographic fit into which accounts are actually showing buying-stage signals right now, it's one of the more sophisticated options available, at a correspondingly enterprise price point.
Features:
- AI-driven buying-stage prediction, estimating whether a target account is in awareness, consideration, or decision stage
- Proprietary intent data combined with Bombora's third-party signals
- Website visitor de-anonymization, surfacing accounts researching you without ever filling out a form
- Full ABM orchestration, connecting TAM identification directly to advertising and sales notification workflows
| Pros | Cons |
|---|---|
| The most sophisticated predictive layer on this list, beyond static fit | Enterprise pricing, commonly $50,000 to $300,000+ annually, is out of reach for smaller teams |
| Ties TAM identification directly to actionable orchestration | Pricing is opaque, gated behind a sales-assisted quote, and scales with TAM size |
| Strong for long, multi-stakeholder enterprise buying cycles | Considerable implementation complexity and a real learning curve |
| Plan | Price | Notes |
|---|---|---|
| Sales Intelligence | Roughly $15,000-$30,000/year | Contact data plus basic intent topics |
| ABM/Predictive bundle | Roughly $50,000-$120,000/year | Full account identification, prediction, and intent for 2,000-10,000 tracked accounts |
| Enterprise | $120,000-$300,000+/year | Larger TAM, advertising orchestration, multi-year contracts common |
6. LinkedIn sales navigator
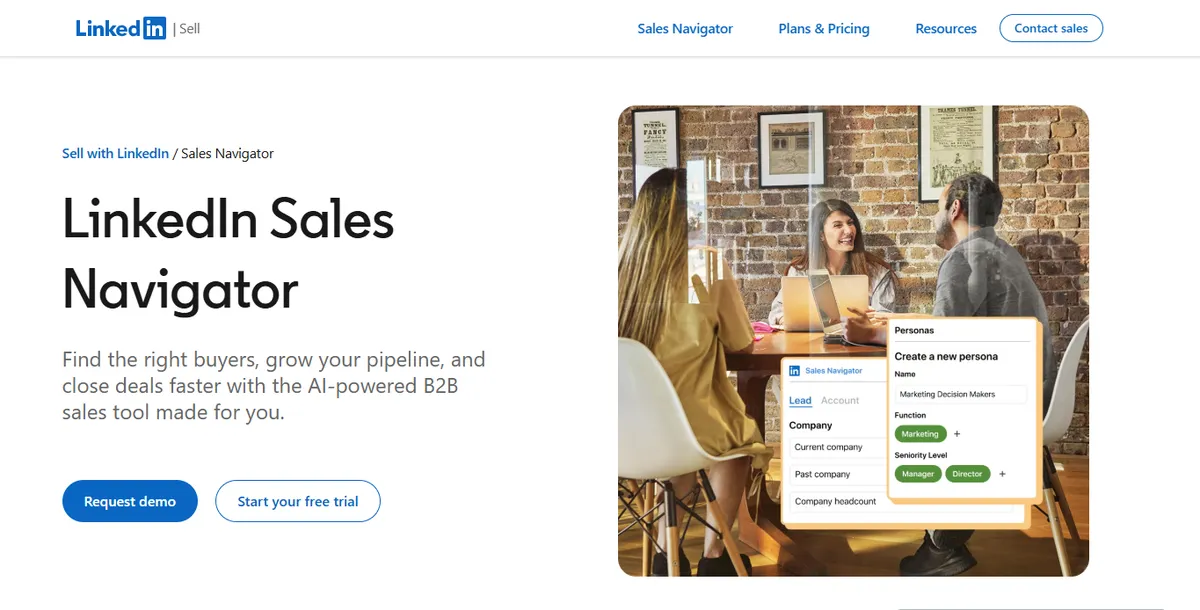
Overview: Sales Navigator is the most widely used tool for building an initial TAM list directly from LinkedIn's own professional graph, particularly valuable for a GTM engineer who needs role-level and org-chart precision that a pure company database can't always match.
Features:
- Advanced firmographic and role-based filtering directly against LinkedIn's real-time professional data
- Saved searches with alerts when new accounts or contacts match defined TAM criteria
- Account and lead lists that sync into a broader enrichment or CRM workflow
- Buyer intent signals specific to LinkedIn activity, like job changes into a target account
| Pros | Cons |
|---|---|
| Role-level and org-chart precision unmatched by a pure company database | List export and API access are limited compared to a dedicated data platform |
| Real-time data reflecting current job changes and org structure | Best used as a layer on top of other tools, not a full TAM pipeline on its own |
| Familiar interface most GTM teams already have some exposure to | Bulk enrichment at real TAM scale requires pairing with another tool |
| Plan | Price | Notes |
|---|---|---|
| Core | Roughly $99/month | Entry tier for individual use |
| Advanced | Roughly $150/month | Adds team features and deeper filtering |
| Advanced Plus | Custom quote | Enterprise tier with CRM integration and bulk features |
7. BuiltWith
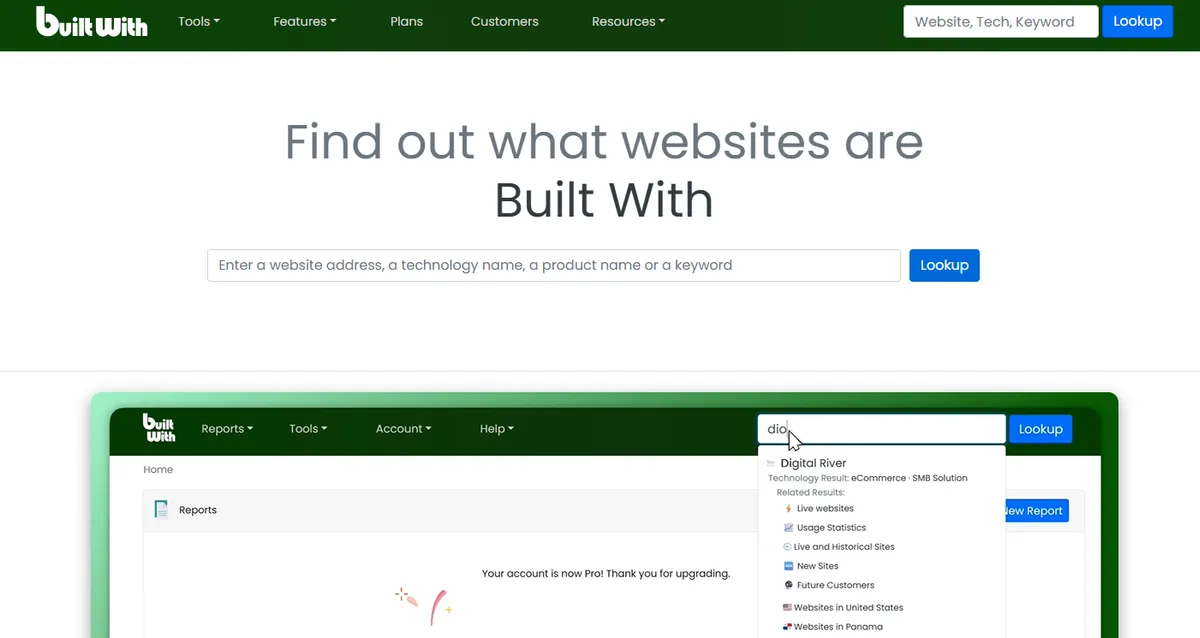
Overview: BuiltWith is the most established technographic data source available, detecting the specific technologies a company's public-facing website runs.
For a GTM engineer whose TAM is defined partly by what tools a target company already uses, competitor displacement targeting, complementary-tool targeting, it's close to unmatched in coverage depth.
Features:
- Detection across 670 million-plus sites and 110,000-plus tracked technologies
- Historical technology adoption timelines, useful for identifying when a company adopted or dropped a specific tool
- Bulk list-building filtered by specific technology criteria
- API access for pulling technographic data directly into a broader enrichment pipeline
| Pros | Cons |
|---|---|
| The deepest technographic detection coverage available | Detection-only; no contact graph, so it needs pairing with a contact enrichment tool |
| Historical adoption data supports genuinely precise competitor-displacement TAM segments | Segmentation by technology alone is static and doesn't reflect active buying signals |
| Strong API access for programmatic TAM pipeline integration | Pricing has been cited by reviewers as steep for the narrow, single-purpose data it provides |
| Plan | Price | Notes |
|---|---|---|
| Basic | Roughly $295/month | Narrow, fixed technology and keyword tracking |
| Pro | Roughly $495/month | Unlimited technology and keyword reports |
| Team/Enterprise | Roughly $995/month+ | Shared logins and full API access |
8. PitchBook
Overview: PitchBook is the deepest available source for private company, investor, and market data, historically built for the venture and private equity world but increasingly used by GTM teams whose TAM mapping requires genuine market-sizing rigor, not just a list of companies, particularly for a business selling into other investor-backed or PE-owned companies.
Features:
- Comprehensive private company, funding, and ownership data, including PE and VC portfolio mapping
- Market-mapping tools for building a structured view of an entire industry vertical, not just individual accounts
- Deal and valuation data supporting genuine bottom-up market-sizing work, not just account list-building
- Analyst-curated industry reports supplementing the raw underlying data
| Pros | Cons |
|---|---|
| Unmatched depth for genuine market-sizing and industry-mapping work | Enterprise, quote-based pricing, generally the most expensive option on this list |
| Strong specifically for TAM work tied to investor or ownership structure | Steeper learning curve, built originally for financial analysts, not GTM operators |
| Curated market reports add context a raw database alone doesn't provide | Overkill for a GTM engineer who just needs an operational account list, not a market study |
| Plan | Price | Notes |
|---|---|---|
| Standard | Custom quote | Typically starts in the low five figures annually per seat |
| Enterprise | Custom quote | Scales considerably higher with more seats and data modules |
Not sure which of these fits your budget and your specific TAM definition? See how my process works before committing to a tool.
How these tools actually combine?
No single tool on this list is a complete TAM mapping solution on its own, and understanding how they layer together matters more than picking a single winner.
A representative approach: start with a broad firmographic universe from Apollo, ZoomInfo, or Crunchbase, depending on whether the target segment skews toward established enterprises, startups, or somewhere in between.
Layer in technographic filtering from BuiltWith to narrow the universe to accounts using a specific, relevant technology. Where budget allows, add 6sense or a comparable intent layer to prioritize which accounts within that narrowed universe are actually showing active buying signals right now, rather than treating every firmographically-qualified account as equally worth pursuing today.
Use Clay to orchestrate the combination of all of the above into one continuously re-runnable, enriched TAM list rather than a series of manually reconciled exports from separate tools.
This layered approach is the same architectural principle covered in more depth in composable data architecture: no single vendor needs to own the entire TAM definition, and the orchestration layer connecting several specialized sources tends to produce a more precise, more defensible account universe than any single tool's native filter set alone.
Common Mistakes in TAM Mapping
Treating TAM mapping as a one-time exercise instead of a maintained pipeline.
A TAM list pulled once and never refreshed goes stale within months as companies grow, shrink, adopt new technology, or simply stop being a fit. A GTM engineer's TAM list should be re-runnable on a defined schedule, not a static export sitting in a spreadsheet.
Using only firmographic filters and ignoring technographic or intent signals.
A TAM defined purely by company size and industry captures a genuinely addressable universe but doesn't prioritize within it. Layering in technographic fit or intent data, where budget allows, turns a flat list into a genuinely prioritized one.
Over-investing in an enterprise ABM platform before validating the TAM definition itself.
Committing to a six-figure 6sense contract before confirming the underlying firmographic and technographic criteria actually produce a well-fit account list is a common, expensive sequencing mistake.
Validate the TAM definition with a cheaper tool first, then layer in the more expensive predictive intelligence once the definition itself is proven.
Relying on a single data source's coverage without checking for gaps.
No single provider on this list has complete coverage of every segment. A TAM built exclusively from one source will systematically miss accounts that source simply doesn't track well, which is exactly the coverage-gap problem a multi-source, waterfall approach through a tool like Clay is designed to close.
A worked example
A GTM engineer at a mid-market SaaS company building a TAM list for a new product line starts with a broad firmographic pull from Apollo, filtered to company size and industry, producing an initial universe of roughly fifteen thousand accounts.
Recognizing that not every firmographically-qualified account is equally relevant, they layer in a BuiltWith technographic filter, narrowing to accounts running a specific complementary technology the new product is designed to integrate with, cutting the list to a more focused four thousand accounts.
Rather than manually exporting and reconciling these two lists, they build a Clay workflow that pulls the Apollo universe, cross-references it against BuiltWith's technographic data programmatically, and re-runs the combination weekly, so the TAM list stays current as new companies adopt the relevant technology rather than freezing at a single point in time.
Given budget constraints, they hold off on adding an enterprise intent layer like 6sense until this narrower, technographically-qualified list has been validated against actual conversion data from a first outbound push, confirming the TAM definition itself is sound before layering in a considerably more expensive predictive signal on top of it.
How I approach TAM mapping?
I build TAM mapping as a layered, continuously maintained system rather than a one-time export, combining firmographic, technographic, and signal-based criteria into a single re-runnable workflow, typically orchestrated through Clay, rather than several disconnected tool exports reconciled manually.
This connects directly to my broader work on signal-based prospecting and GTM data infrastructure, since a TAM list is only as useful as the pipeline keeping it current and feeding it into the workflows that actually act on it.
Every TAM system I build is validated against real conversion data before layering in more expensive intelligence on top, so budget goes toward the specific enrichment that's actually earning its cost for your particular business.
Conclusion
TAM mapping for a GTM engineer isn't a slide, it's an operational pipeline, and the right tool or combination of tools depends on how your specific addressable market is actually defined: broad firmographic fit, technographic precision, active buying signals, or some deliberate combination of all three.
The teams building the most useful TAM systems aren't the ones spending the most on the single most sophisticated platform, they're the ones layering the right tools together and keeping the resulting list continuously current rather than treating it as a one-time export.
Ready to build a TAM mapping pipeline that actually stays current? Book a call, no decks, no demos, just a working session on your market.
Frequently Asked Questions
What's the difference between TAM mapping and lead enrichment?
TAM mapping defines the full universe of accounts that fit your addressable market. Enrichment adds detail to records already inside that universe, firmographic data, contact information, signals. TAM mapping typically happens first, defining who belongs in the list, with enrichment applied afterward to make each record actionable.
Do I need an enterprise tool like 6sense or PitchBook to build a real TAM list?
Not initially. A well-scoped firmographic pull from Apollo, ZoomInfo, or Crunchbase, combined with technographic filtering from BuiltWith where relevant, produces a solid, validated TAM definition at a fraction of an enterprise ABM platform's cost. Enterprise intent and predictive tools are worth layering in once the underlying TAM definition has already been validated, not before.
How often should a TAM list be refreshed?
At minimum, quarterly, and more frequently for fast-moving segments or a technographically-defined TAM where technology adoption changes faster than broad firmographic criteria do. A TAM list that's re-runnable on a schedule, rather than a static one-time export, is what keeps it useful rather than slowly going stale.
Can Clay replace all of the other tools on this list?
Not entirely. Clay orchestrates and combines data from other providers rather than generating its own primary firmographic, technographic, or intent data from scratch. It's the strongest tool for combining and operationalizing TAM data from the other sources on this list, not a replacement for those underlying data sources themselves.
Which tool is the best starting point for a small team with limited budget?
Apollo is generally the most accessible starting point, combining a usable database with built-in filtering and execution at a meaningfully lower entry price than the enterprise options on this list. A small team can build and validate a real TAM definition there before considering whether a more specialized or more expensive tool is actually warranted.
Let's build
what your
company needs.
Drop your email. We'll send The Custom Agent Blueprint on what we'd build first for a company like yours, before you ever take a meeting.